Notice
Recent Posts
Recent Comments
Link
| 일 | 월 | 화 | 수 | 목 | 금 | 토 |
|---|---|---|---|---|---|---|
| 1 | 2 | 3 | ||||
| 4 | 5 | 6 | 7 | 8 | 9 | 10 |
| 11 | 12 | 13 | 14 | 15 | 16 | 17 |
| 18 | 19 | 20 | 21 | 22 | 23 | 24 |
| 25 | 26 | 27 | 28 | 29 | 30 | 31 |
Tags
- pandas
- seaborn
- 프로그래머스
- R
- Python
- oracle
- SQL
- sklearn
- 빅데이터 분석 기사
- 빅분기
- 머신러닝
- 데이터 분석
- 파이썬
- level 2
- Kaggle
- 알고리즘
- Oracel
- matplotlib
- python3
- 코딩테스트
- Numpy
- 실기
- level 1
- 실습
- 카카오
- 튜닝
- 오라클
Archives
- Today
- Total
라일락 꽃이 피는 날
[Matplotlib] 다양한 그래프 그리기 1 본문
728x90
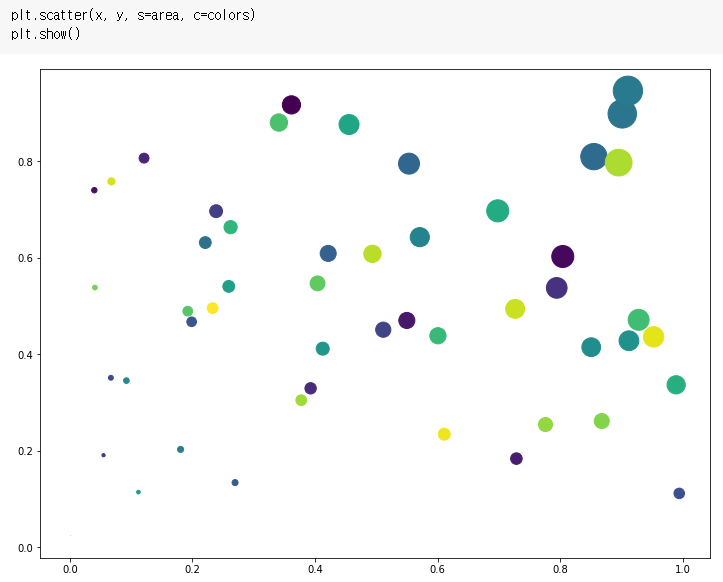
1. Scatterplot
x = np.random.rand(50)
y = np.random.rand(50)

colors = np.arange(50)
area = x * y * 1000
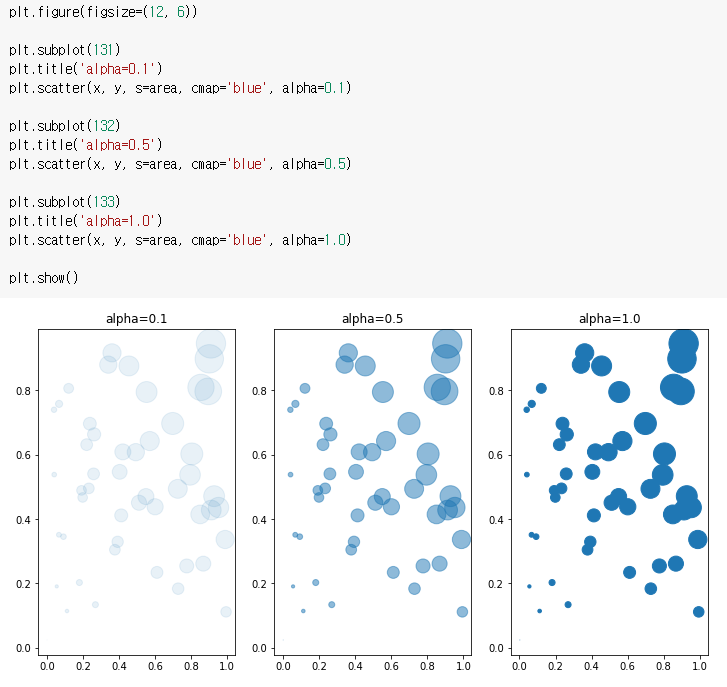
s: 점의 넓이 / c: 점의 색상 / cmap: 모두 같은 점의 색상 / alpha: 점의 투명도
2. Barplot, Barhplot
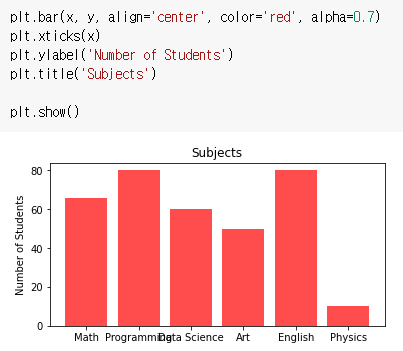
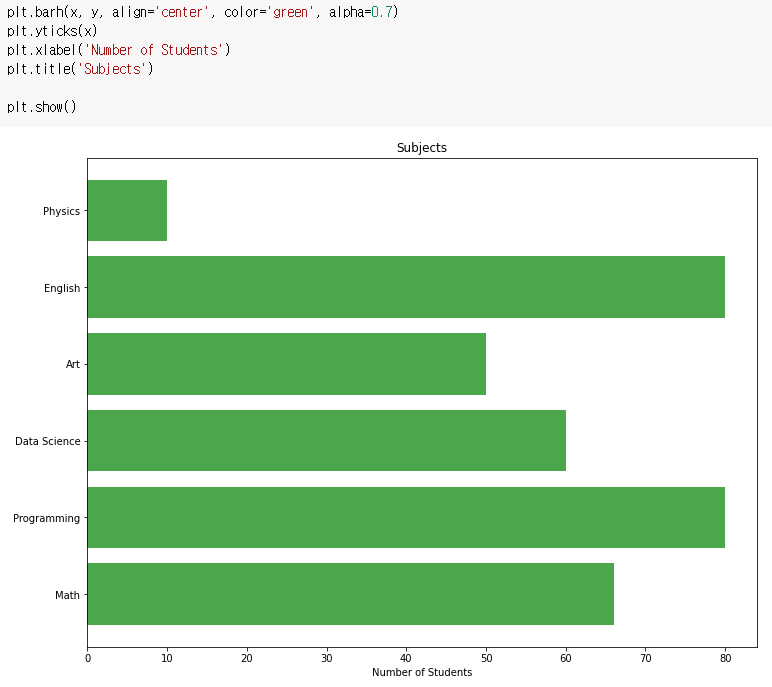
x = ['Math', 'Programming', 'Data Science', 'Art', 'English', 'Physics']
y = [66, 80, 60, 50, 80, 10]
barh 함수에서는 xticks로 설정했던 부분을 yticks로 변경
Batplot에서 비교 그래프 그리기
x_label = ['Math', 'Programming', 'Data Science', 'Art', 'English', 'Physics']

x = np.arange(len(x_label))
y_1 = [66, 80, 60, 50, 80, 10]
y_2 = [55, 90, 40, 60, 70, 20]

width = 0.35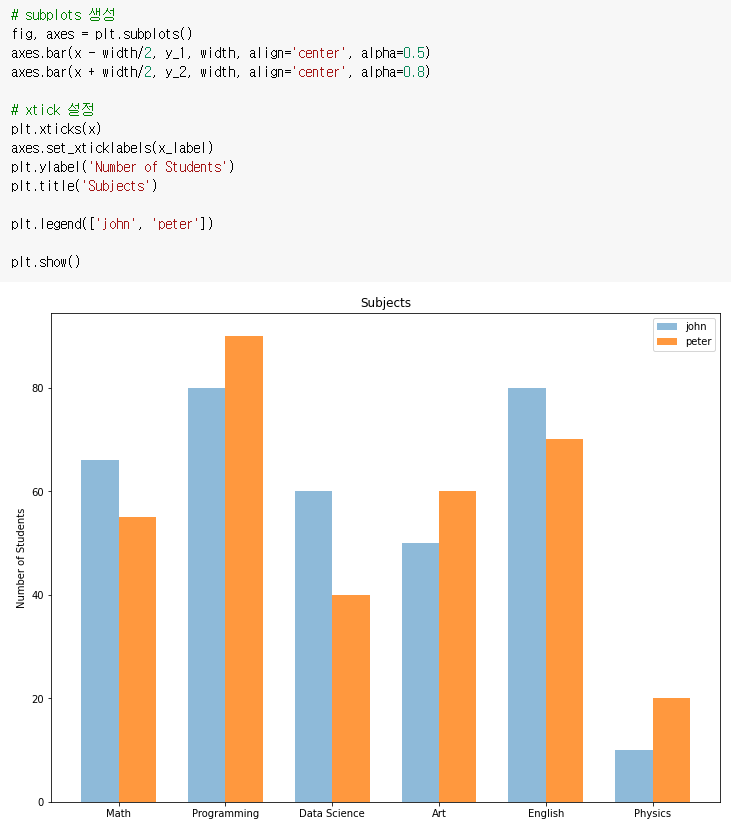
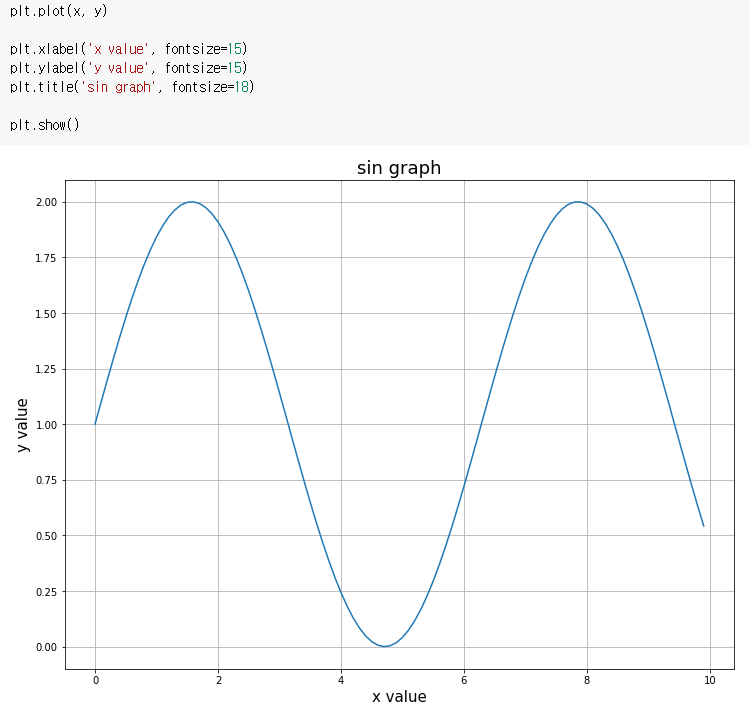
3. Line Plot
x = np.arange(0, 10, 0.1)
y = 1 + np.sin(x)
2개 이상의 그래프 그리기
x = np.arange(0, 10, 0.1)
y_1 = 1 + np.sin(x)
y_2 = 1 + np.cos(x)

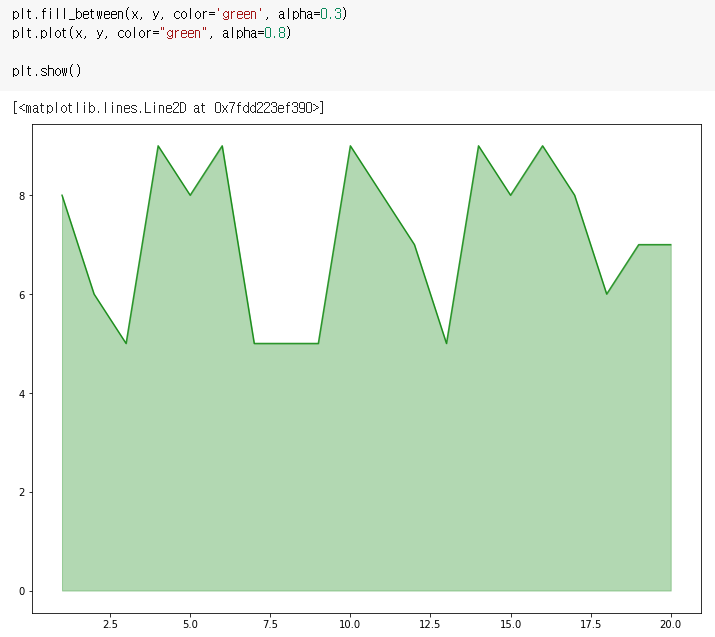
4. Areaplot (Filled Area)
x = np.arange(1,21)
y = np.random.randint(low=5, high=10, size=20)
fill_between으로 색칠하기 ⇒ 경계선은 굵게, area는 옅게 그리는 효과 적용
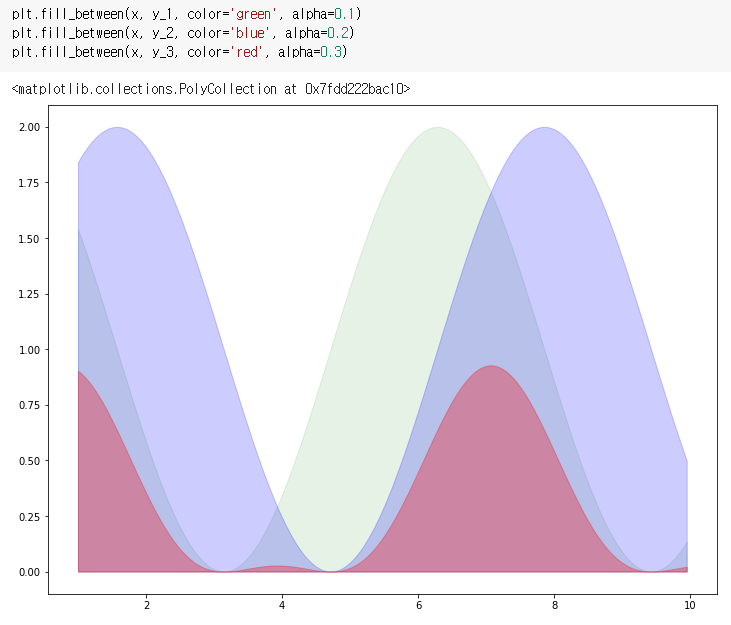
여러 그래프를 겹쳐서 표현
x = np.arange(1, 10, 0.05)
y_1 = np.cos(x)+1
y_2 = np.sin(x)+1
y_3 = y_1 * y_2 / np.pi
5. Histogram
N = 100000
x = np.random.randn(N)
bins = 30  # 구간
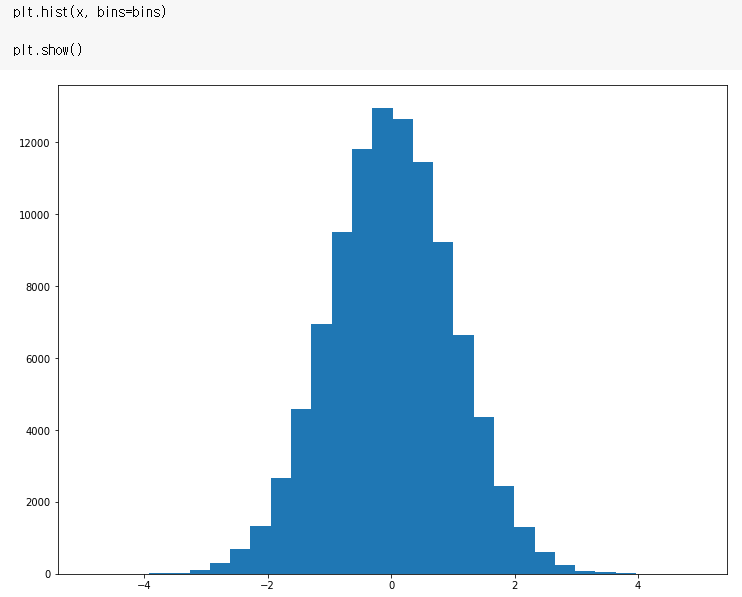
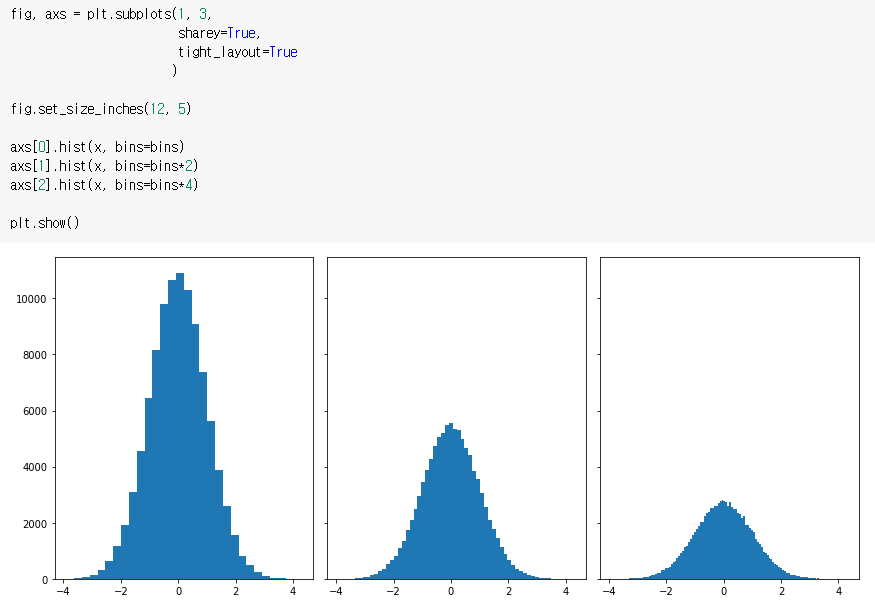
다중 Histogram 그리기
sharex: x축을 다중 그래프가 share
sharey: y축을 다중 그래프가 share
tight_layout: graph의 패딩을 자동으로 조절해주어 fit한 graph를 생성
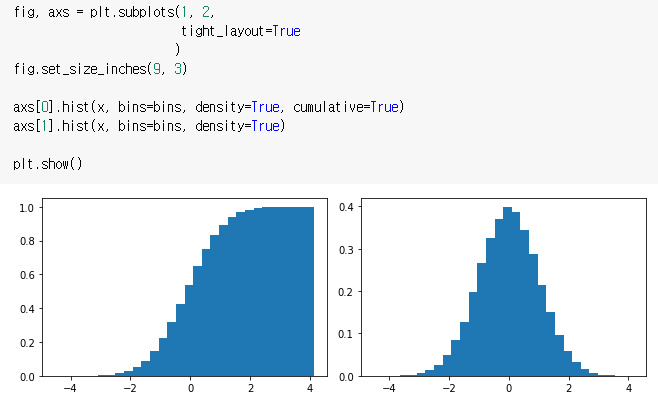
Y축에 Density 표기
density=True: Y축에 density 표기
cumulative=True: 누적분포 표기
728x90
'데이터 분석 > Python' 카테고리의 다른 글
| [Seaborn] matplotlib 그래프를 seaborn으로 그리기 (0) | 2021.05.11 |
|---|---|
| [Matplotlib] 다양한 그래프 그리기 2 (0) | 2021.05.11 |
| [Matplotlib] 스타일 설정 (0) | 2021.05.08 |
| [Matplotlib] 기본 그래프 그리기 (0) | 2021.05.08 |
| [Matplotlib] colab 한글 깨짐 현상 해결 방법 (0) | 2021.05.08 |

