Notice
Recent Posts
Recent Comments
Link
| 일 | 월 | 화 | 수 | 목 | 금 | 토 |
|---|---|---|---|---|---|---|
| 1 | 2 | 3 | ||||
| 4 | 5 | 6 | 7 | 8 | 9 | 10 |
| 11 | 12 | 13 | 14 | 15 | 16 | 17 |
| 18 | 19 | 20 | 21 | 22 | 23 | 24 |
| 25 | 26 | 27 | 28 | 29 | 30 | 31 |
Tags
- 알고리즘
- R
- 카카오
- Kaggle
- Oracel
- oracle
- matplotlib
- Python
- level 2
- pandas
- 코딩테스트
- 데이터 분석
- 실습
- 오라클
- 프로그래머스
- seaborn
- 빅데이터 분석 기사
- Numpy
- 파이썬
- sklearn
- SQL
- 머신러닝
- level 1
- 빅분기
- 튜닝
- python3
- 실기
Archives
- Today
- Total
라일락 꽃이 피는 날
[R] PCA (주성분 분석) 1 본문
728x90
PCA (주성분 분석) : Principal Component Analysis
데이터에서 가장 중요한 성분을 순서대로 추출하는 기법
- 분산을 가장 잘 설명해주는 축이 주성분1 (PC1)
- PC1에 직교하는 축이 주성분2 (PC2)
주성분의 개수 설정 방법
1. 시각화를 위해 2~3개로 설정
2. Eigenvalue (주성분 분산) > 1 을 기준으로 설정
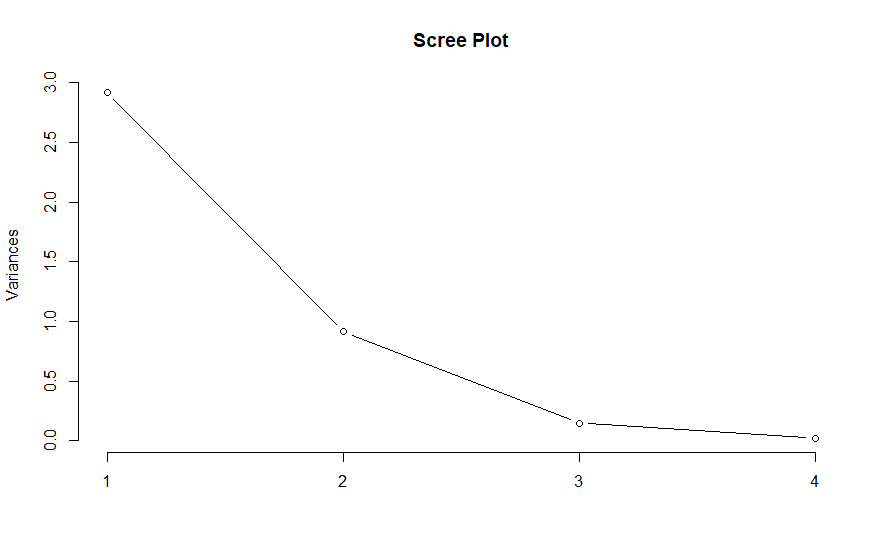
3. scree plot에서 elbow point로 설정
데이터 확인
head(iris)
결측치 확인
colSums(is.na(iris))
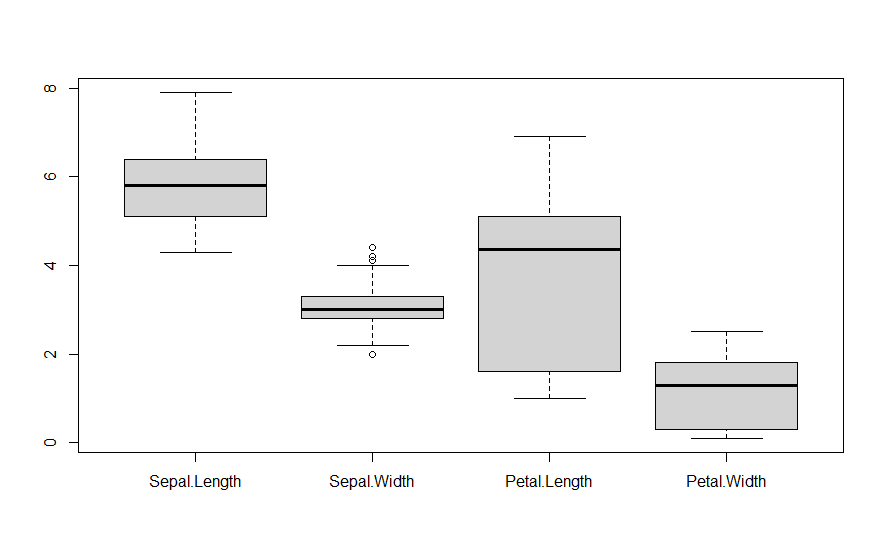
변수별 기술통계 및 분포
summary(iris)
boxplot(iris[,1:4])
pca 함수 적용
center = T, scale. = T : 평균 = 0, 분산 = 1 로 표준화
iris.pca <- prcomp(iris[1:4], center = T, scale. = T)
pca 요약 정보
Standard deviation 제곱 = 분산 = eigenvalue
Proportion of Variance : 전체 분산에서 차지하는 비율
summary(iris.pca)
각 주성분의 eigenvector
iris.pca$rotation
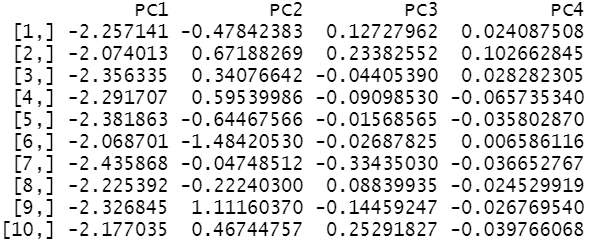
각 주성분의 값
head(iris.pca$x, 10)
scree plot 확인
type = 'l' : 선(Line) 그래프
plot(iris.pca, type = 'l', main = 'Scree Plot')
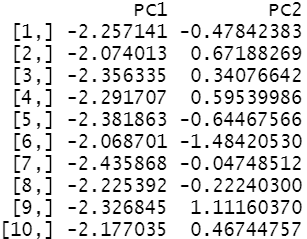
2개의 차원으로 축소
head(iris.pca$x[,1:2], 10)
2차원으로 축소된 데이터 시각화
install.packages("ggfortify")
library(ggfortify)

autoplot(iris.pca, data = iris, colour = 'Species')
728x90
'데이터 분석 > R' 카테고리의 다른 글
| [R] K-means clustering (K-평균 군집화) 1 (0) | 2021.07.08 |
|---|---|
| [R] PCA (주성분 분석) 2 (0) | 2021.07.08 |
| [R] Support Vector Machine (SVM) (0) | 2021.07.02 |
| [R] Decision Tree & Random Forest (0) | 2021.07.02 |
| [R] Naive Bayes Classification (나이브 베이즈 분류) (0) | 2021.07.02 |
