Notice
Recent Posts
Recent Comments
Link
| 일 | 월 | 화 | 수 | 목 | 금 | 토 |
|---|---|---|---|---|---|---|
| 1 | 2 | 3 | ||||
| 4 | 5 | 6 | 7 | 8 | 9 | 10 |
| 11 | 12 | 13 | 14 | 15 | 16 | 17 |
| 18 | 19 | 20 | 21 | 22 | 23 | 24 |
| 25 | 26 | 27 | 28 | 29 | 30 | 31 |
Tags
- 카카오
- 데이터 분석
- 프로그래머스
- 실습
- level 2
- level 1
- Numpy
- python3
- 파이썬
- R
- 실기
- sklearn
- 튜닝
- matplotlib
- Kaggle
- seaborn
- pandas
- 오라클
- SQL
- Oracel
- 코딩테스트
- oracle
- Python
- 빅데이터 분석 기사
- 알고리즘
- 빅분기
- 머신러닝
Archives
- Today
- Total
라일락 꽃이 피는 날
[R] Logistic Regression (로지스틱 회귀) 본문
728x90
Logistic Regression (로지스틱 회귀)
1. Boosted Logistic Regression
method = 'LogitBoost'
2. Logistic Model Trees
method = 'LMT'
3. Penalized Logistic Regression
method = 'plr'
4. Regularized Logistic Regression
method = 'regLogistic'
데이터 불러오기
rawdata <- read.csv("heart.csv", header = TRUE)
str(rawdata)
타겟 클래스 범주화
rawdata$target <- as.factor(rawdata$target)
unique(rawdata$target)
연속형 독립변수 표준화
rawdata$age <- scale(rawdata$age)
rawdata$trestbps <- scale(rawdata$trestbps)
rawdata$chol <- scale(rawdata$chol)
rawdata$thalach <- scale(rawdata$thalach)
rawdata$oldpeak <- scale(rawdata$oldpeak)
rawdata$slope <- scale(rawdata$slope)
범주형 독립변수를 명목형 변수로 전환
newdata <- rawdata
factorVar <- c("sex", "cp", "fbs", "restecg", "exang", "ca", "thal")
newdata[, factorVar] = lapply(newdata[, factorVar], factor)
트레이닝-테스트 셋 분리 (7:3)
set.seed(2020)  # 시드

datatotal <- sort(sample(nrow(newdata), nrow(newdata)*.7))

train <- newdata[datatotal,]
test <- newdata[-datatotal,]

train_x <- train[,1:12]
train_y <- train[,13]

test_x <- test[,1:12]
test_y <- test[,13]
LogitBoost
ctrl <- trainControl(method = "repeatedcv", repeats = 5)

logitFit <- train(target~.,
                  data = train,
                  method = "LogitBoost",  # 원하는 로지스틱 모형 선택
                  trControl = ctrl,
                  metric = "Accuracy")

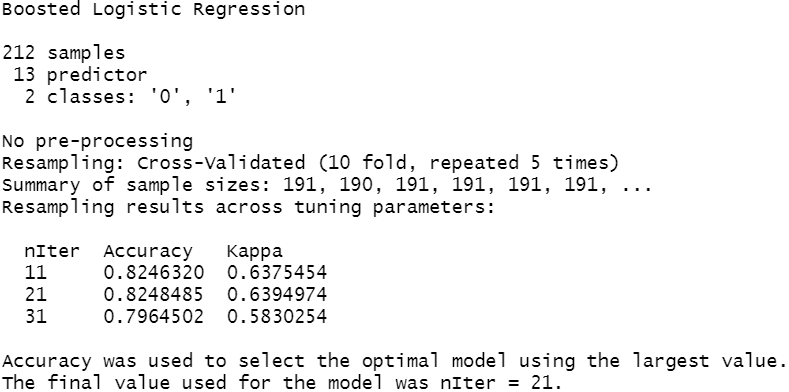
logitFit
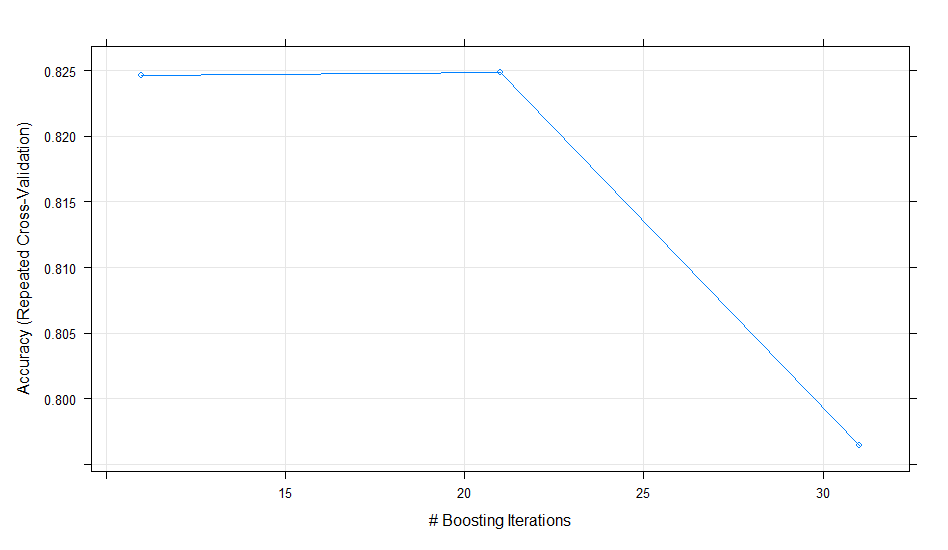
→ nIter = 21일 때, 가장 높은 정확도를 가진다.
→ 학습을 21번 반복했을 때, 가장 높은 정확도를 가진다.
plot(logitFit) 
예측
pred_test <- predict(logitFit, newdata = test)
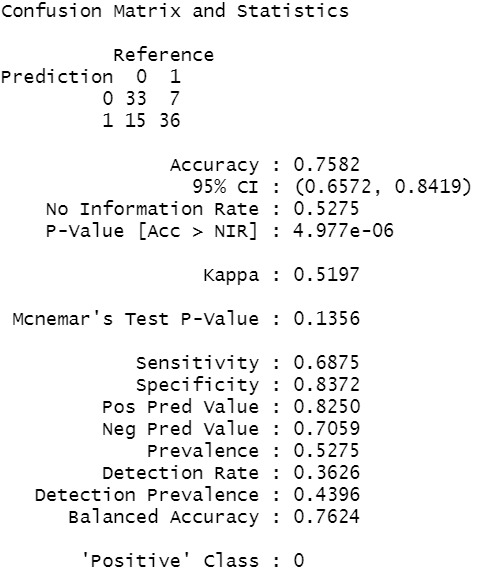
confusionMatrix(pred_test, test$target)
→ Accuracy : 0.7582, Kappa : 0.5197
변수중요도
importance_logit <- varImp(logitFit, scale = FALSE)
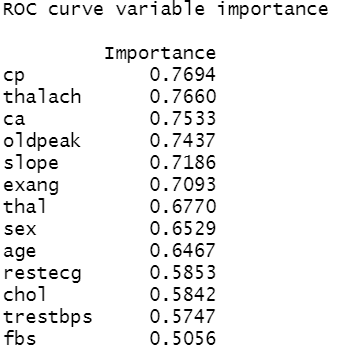
importance_logit
plot(importance_logit)
→ "cp" 변수의 중요도가 가장 높다.
728x90
'데이터 분석 > R' 카테고리의 다른 글
| [R] Decision Tree & Random Forest (0) | 2021.07.02 |
|---|---|
| [R] Naive Bayes Classification (나이브 베이즈 분류) (0) | 2021.07.02 |
| [R] k-Nearest Neighbor (KNN) (1) | 2021.06.30 |
| [R] 카이제곱 검정 (0) | 2021.06.27 |
| [R] ANOVA 검정 (0) | 2021.06.27 |
